js文件,将一下代码复制进去( function ( global) {
global. tools = global. tools || { } ;
tools. loopShowTooltip = function ( chart, chartOption, options) {
var defaultOptions = {
interval: 2000 ,
loopSeries: false ,
seriesIndex: 0 ,
updateData: null
} ;
if ( ! chart || ! chartOption) {
return { } ;
}
var dataIndex = 0 ;
var seriesIndex = 0 ;
var timeTicket = 0 ;
var seriesLen = chartOption. series. length;
var dataLen = 0 ;
var chartType;
var first = true ;
if ( options) {
options. interval = options. interval || defaultOptions. interval;
options. loopSeries = options. loopSeries || defaultOptions. loopSeries;
options. seriesIndex = options. seriesIndex || defaultOptions. seriesIndex;
options. updateData = options. updateData || defaultOptions. updateData;
} else {
options = defaultOptions;
}
if ( options. seriesIndex < 0 || options. seriesIndex >= seriesLen) {
seriesIndex = 0 ;
} else {
seriesIndex = options. seriesIndex;
}
function autoShowTip ( ) {
function showTip ( ) {
if ( dataIndex === 0 && ! first && typeof options. updateData === "function" ) {
options. updateData ( ) ;
chart. setOption ( chartOption) ;
document. getElementById ( 'pie1Word' ) . innerHTML = dataIndex;
}
var series = chartOption. series;
chartType = series[ seriesIndex] . type;
dataLen = series[ seriesIndex] . data. length;
var tipParams = { seriesIndex: seriesIndex} ;
switch ( chartType) {
case 'map' :
case 'pie' :
case 'chord' :
tipParams. name = series[ seriesIndex] . data[ dataIndex] . name;
break ;
case 'radar' :
tipParams. seriesIndex = seriesIndex;
tipParams. dataIndex = dataIndex;
break ;
default :
tipParams. dataIndex = dataIndex;
break ;
}
if ( chartType === 'pie' || chartType === 'radar' ) {
chart. dispatchAction ( {
type: 'downplay' ,
seriesIndex: options. loopSeries ? ( seriesIndex === 0 ? seriesLen - 1 : seriesIndex - 1 ) : seriesIndex,
dataIndex: dataIndex === 0 ? dataLen - 1 : dataIndex - 1
} ) ;
chart. dispatchAction ( {
type: 'highlight' ,
seriesIndex: seriesIndex,
dataIndex: dataIndex,
} ) ;
}
tipParams. type = 'showTip' ;
chart. dispatchAction ( tipParams) ;
dataIndex = ( dataIndex + 1 ) % dataLen;
if ( options. loopSeries && dataIndex === 0 && ! first) {
seriesIndex = ( seriesIndex + 1 ) % seriesLen;
}
first = false ;
}
showTip ( ) ;
timeTicket = setInterval ( showTip, options. interval) ;
}
function stopAutoShow ( ) {
if ( timeTicket) {
clearInterval ( timeTicket) ;
timeTicket = 0 ;
if ( chartType === 'pie' || chartType === 'radar' ) {
chart. dispatchAction ( {
type: 'downplay' ,
seriesIndex: options. loopSeries ? ( seriesIndex === 0 ? seriesLen - 1 : seriesIndex - 1 ) : seriesIndex,
dataIndex: dataIndex === 0 ? dataLen - 1 : dataIndex - 1
} ) ;
}
}
}
var zRender = chart. getZr ( ) ;
function zRenderMouseMove ( param) {
if ( param. event) {
param. event. cancelBubble = true ;
}
stopAutoShow ( ) ;
}
function zRenderGlobalOut ( ) {
if ( ! timeTicket) {
autoShowTip ( ) ;
}
}
chart. on ( 'mousemove' , stopAutoShow) ;
zRender. on ( 'mousemove' , zRenderMouseMove) ;
zRender. on ( 'globalout' , zRenderGlobalOut) ;
autoShowTip ( ) ;
return {
clearLoop: function ( ) {
if ( timeTicket) {
clearInterval ( timeTicket) ;
timeTicket = 0 ;
}
chart. off ( 'mousemove' , stopAutoShow) ;
zRender. off ( 'mousemove' , zRenderMouseMove) ;
zRender. off ( 'globalout' , zRenderGlobalOut) ;
}
} ;
} ;
} ) ( window) ;
vue"><template>
<div style="width: 100%; height: 100%" id="chartsL"></div>
</template>
<script>
import echarts from "echarts ";
export default {
mounted() {
this.drawLine();
},
methods: {
drawLine() {
let img = require("@/assets/img/zjx/analysisTypesChart.png");
let myChart = echarts .init(document.getElementById("chartsL"));
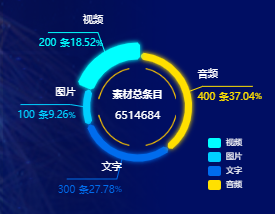
var trafficWay = [
{
name: "视频",
value: 200,
fontSize: 10,
},
{
name: "图片",
value: 100,
fontSize: 10,
},
{
name: "文字",
value: 300,
fontSize: 10,
},
{
name: "音频",
value: 400,
fontSize: 10,
},
];
var dataTs = ["视频", "图片", "文字", "音频"];
var data = [];
var color = [
"#00ffff",
"#00cfff",
"#006ced",
"#ffe000",
"#ffa800",
"#ff5b00",
"#ff3000",
];
for (var i = 0; i < trafficWay.length; i++) {
data.push(
{
value: trafficWay[i].value,
name: trafficWay[i].name,
itemStyle: {
normal: {
borderWidth: 5,
shadowBlur: 5, //圆环阴影
borderColor: color[i],
shadowColor: color[i],
},
},
},
{
value: 20, //间隙
name: "",
itemStyle: {
normal: {
label: {
show: false,
},
labelLine: {
show: false,
},
color: "rgba(0, 0, 0, 0)",
borderColor: "rgba(0, 0, 0, 0)",
borderWidth: 0,
},
},
}
);
}
var seriesOption = [
{
name: "",
type: "pie",
clockWise: false,
radius: [50, 52],
hoverAnimation: true,
itemStyle: {
normal: {
label: {
// normal:{},
show: true,
position: "outside",
// color: '#fff',//指示字体颜色
formatter: ["{b|{b}}", "{c|{c}} {f|条}{d|{d}}{e|%}"].join("\n"),
// formatter: ['{a|{a}}', '{c|{c}}'].join('\n'),
rich: {
b: {
color: "#fff",
fontSize: 10,
},
c: {
fontSize: 10,
},
d: {
fontSize: 10,
},
e: {
// color: '#fff',
fontSize: 8,
},
f: {
fontSize: 10,
},
},
padding: [-40, -60], //牵引线调整字体距离
},
labelLine: {
length: 20, //角度长度
length2: 50, //水平长度
show: true,
color: "#00ffff",
},
},
},
data: data,
},
];
var option = {
color: color,
title: {
text: "素材总条目",
subtext: "6514684",
left: "center",
top: "40%",
// top: "center",
textStyle: {
fontSize: 10,
color: "#fff",
},
subtextStyle: {
fontSize: 11,
color: "#fff",
},
},
graphic: {
elements: [
//内圆环样式
{
type: "image",
z: 3,
style: {
image: img,
width: 78,
height: 78,
},
left: "center",
top: "center",
position: [100, 100],
},
],
},
tooltip: {
show: false,
},
legend: {
//标尺那一块样式
icon: "roundRect",
orient: "vertical",
itemWidth: 13,
itemHeight: 10,
// x: 'left',
data: dataTs,
left: 200, //调整标尺的位置
bottom: 20,
align: "left",
textStyle: {
color: "#fff",
fontSize: 8,
},
style: {
width: 10,
height: 10,
},
itemGap: 4, //标识字体行间距
},
toolbox: {
show: false,
},
series: seriesOption,
}
//使用制定的配置项和数据显示图表
myChart.setOption(option);
function createExample(option, tooltipOption) {
// 基于准备好的dom,初始化echarts 图表
// 为echarts 对象加载数据
myChart.setOption(option);
tools.loopShowTooltip(myChart, option, tooltipOption); //第一个参数需要改一下
}
createExample(option, {
loopSeries: true,
// 间隔时间
interval: 2000,
});
},
},
};
</script>